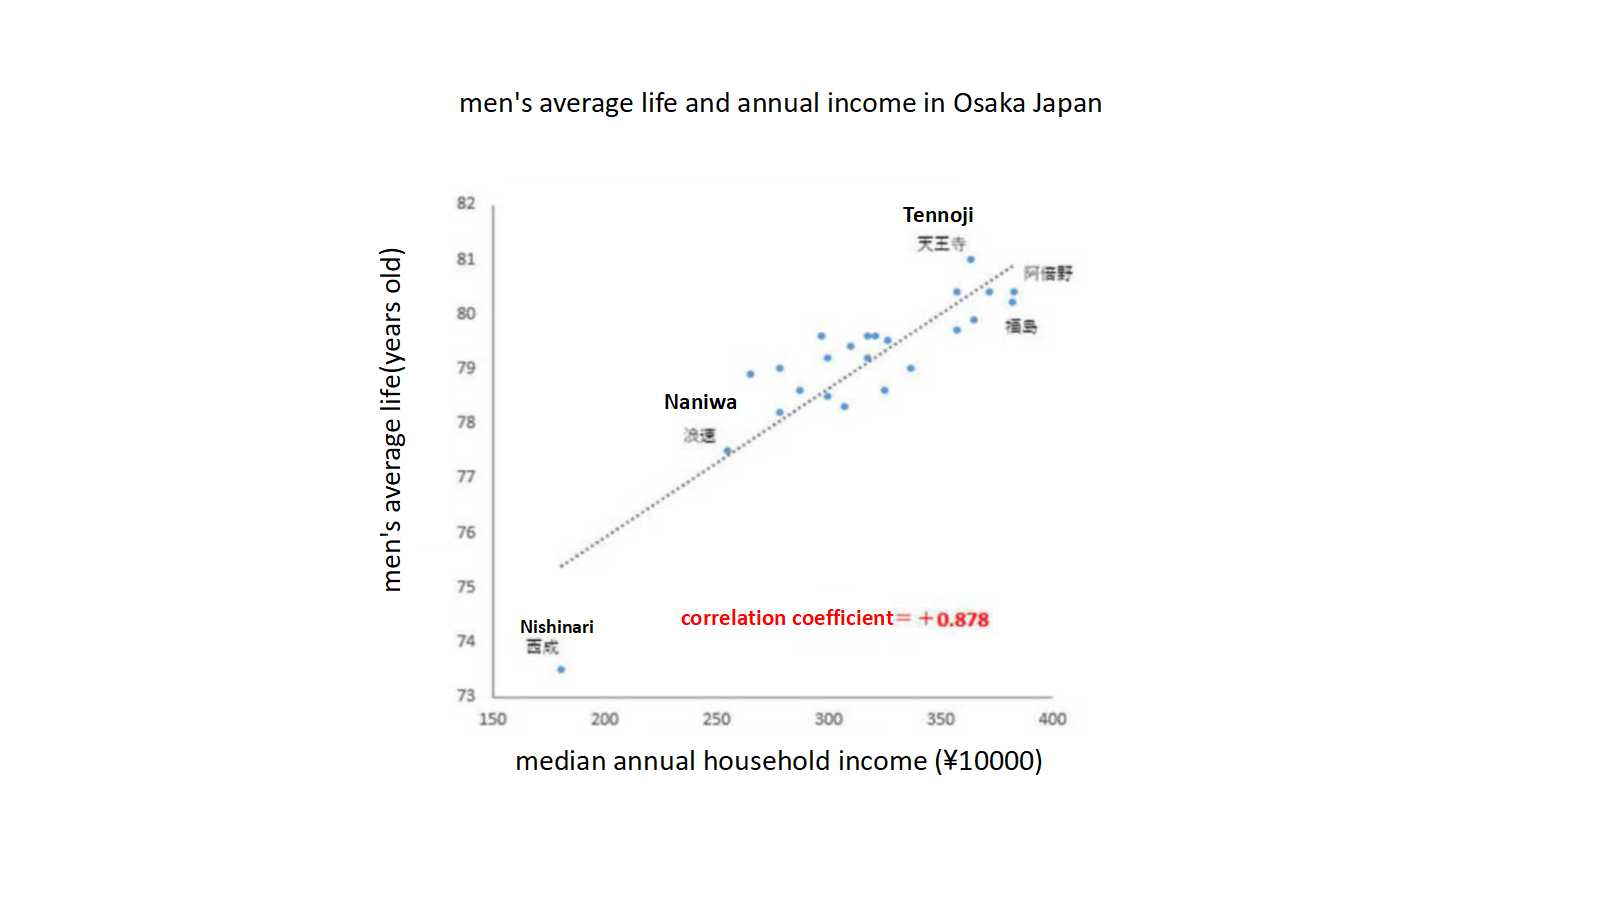
 The photo shown is the relationship between household income and life expectancy in Osaka. Correlation coefficient about 0.9. Anyone who has made this kind of graph will know. 0.9 shows a very strong positive correlation. Since there are many homeless people in famous Nishinari, the average life expectancy of 7 to 8 years differs between the Nishinari and Tennoji. Naniwa and Tennoji are also 4 years difference. What is the reason for the longevity of a large household income group? Medical checkup?, education?, food?, living environment? I understand that the lifespan of homeless people in Nishinari is short. They have never done a health checkup, they don’t take a bath, they feel like exercising at the gym is a waste of time. A life that seems to be bad for everyone’s health. As an example, there was a story about a woman who became diabetic in her thirties, had poor eyesight, and renal failure occurred with diabetic. She says that kidney dialysis treatment will be needed in a few months. She said he she didn’t respond to diabetic even though she knew she got diabetic because she didn’t have enough money. She was under the condition of non-regular employment from a young days. When she returned home after working long hours, she often ate two convenience store lunch boxes and 500 mL of beer as a habit. She went to the hospital for the first time when she couldn’t see the goods clearly and had trouble in the work. This is one example of how low income affects lifespan.
